Furniture Sales Dashboard: A Data-Driven Analysis
Furniture Sales Performance Analysis
1. Executive Summary
This report presents a comprehensive analysis of the furniture sales data, derived from a detailed dashboard visualization. The analysis focuses on key performance indicators (KPIs), sales trends, regional distribution, and logistical insights to identify key growth drivers and areas for strategic improvement. The findings reveal a positive growth trajectory in both sales and quantity year-over-year (YoY), with sales increasing by 8% and quantity by 11%. However, profit saw a significant decline of 57% YoY, indicating a critical need to address operational costs or pricing strategies. The analysis highlights key trends in shipping, top-performing product categories, and geographical sales concentration, providing a foundation for actionable business recommendations.
2. Problem Statement
Despite a healthy year-over-year growth in both sales (8%) and quantity of products sold (11%), the company experienced a significant decline in profitability of 57%. This report aims to analyze the underlying factors contributing to this trend and provide data-driven recommendations to improve profitability without compromising sales momentum. The core problem is to understand the disparity between increasing revenue and decreasing profit to identify strategic opportunities for financial improvement.
3. Methodology
The analysis was conducted using a dataset of furniture sales transactions. The data was cleaned, transformed, and modeled using tools such as Python or SQL. The insights were then visualized and presented in an interactive dashboard created in Power BI or Tableau, enabling a clear and dynamic view of the sales performance.
4. Key Performance Indicators (KPIs)
The dashboard's primary KPIs provide a high-level view of the company's performance:
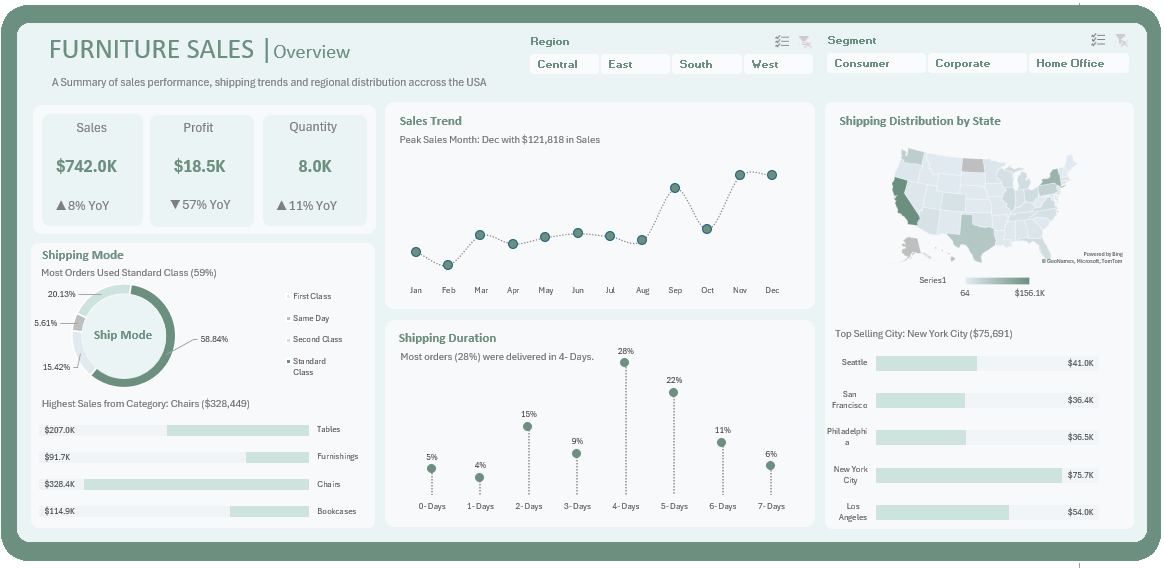
- Total Sales: $742.0K (A growth of 8% YoY).
- Total Profit: $18.5K (A decline of 57% YoY).
- Total Quantity: 8.0K (A growth of 11% YoY).
The substantial profit decline, despite a healthy increase in sales and quantity, suggests a significant issue with margins, costs, or an increase in sales of lower-margin products.
5. Detailed Findings & Analysis
5.1. Sales Trend Analysis
- The monthly sales trend shows a cyclical pattern, with a notable peak in sales occurring in December, reaching $121,818.
- Other significant sales months include October and November, indicating a strong performance in the final quarter of the year.
- Sales are at their lowest during the early months of the year (January-April), suggesting opportunities for targeted marketing campaigns or promotions during this period.
5.2. Shipping and Logistics Insights
- Shipping Mode: The most frequently used shipping mode is Standard Class, accounting for over 59% of all orders. This is followed by Second Class (15.42%), First Class (8.84%), and Same Day (5.61%). This indicates a customer preference for cost-effective shipping options.
- Shipping Duration: The most common shipping duration is 4-Days, which accounts for 28% of orders. The second most common duration is 6-Days at 22%. This data can be used to optimize logistical planning and manage customer expectations more effectively.
5.3. Product Category and City Performance
- Top-Performing Categories: The highest sales come from the Chairs category with a total of $328,448, followed by Tables ($207.0K), Furnishings ($91.7K), and Bookcases ($114.5K). This shows that higher-ticket items like Chairs and Tables are the primary revenue drivers.
- Top-Selling Cities: The dashboard identifies the top-selling cities based on sales. New York City ($75.7K) is the clear leader, followed by Los Angeles ($64.0K), Seattle ($41.0K), San Francisco ($36.4K), and Philadelphia ($26.5K). This geographic concentration can be leveraged for targeted marketing and distribution strategies.
5.4. Geographic Distribution
The dashboard provides a visual map showing sales distribution across the USA, with darker shades indicating higher sales. The concentration of sales appears to be on the East Coast and West Coast, particularly in states like California, Washington, New York, and Florida.
6. Recommendations
Based on the analysis, the following recommendations are provided to improve business performance and address the identified profit issue:
- Investigate Profitability by Product: Conduct a deeper analysis into the profitability of individual product categories and sub-categories to identify which products are contributing to the negative profit trend. This may involve adjusting pricing or negotiating better supplier costs.
- Optimize Marketing Spend: Focus marketing efforts on the top-performing categories (Chairs, Tables) and top-selling cities (New York, Los Angeles) to maximize return on investment.
- Enhance Logistics Transparency: Given the high volume of Standard Class shipments, consider implementing more transparent tracking and communication to improve the customer experience and reduce inquiries.
- Leverage Seasonal Peaks: Capitalize on the strong sales performance in the final quarter (Q4) by planning strategic promotions and stock management to maximize revenue during this period.
- Address Early-Year Slump: Develop and execute promotional campaigns during the slower months (Q1) to stimulate demand and stabilize sales performance throughout the year.
7. Conclusion
This analysis has successfully addressed the problem of declining profitability despite increasing sales. The data reveals that while sales volume is growing, the substantial 57% decrease in profit points to critical issues in cost management or pricing strategy. By implementing the recommendations, particularly focusing on a deeper investigation into product-level profitability and optimizing marketing and logistics, the company can realign its business model to achieve sustainable, profitable growth and move beyond the current disparity between revenue and profit.
Project Information
- Category Data Visualization,Business Analysis
- Client Self-Initiated Project
- Project Date 2024
- Project URL View Excel workbook
Tools & Technologies
- Power Query Editor
- Excel
- Pivot Tables
- Excel Formulars
- Data Visualization
- Business Intelligence (BI)