WHO Covid-19 Analysis
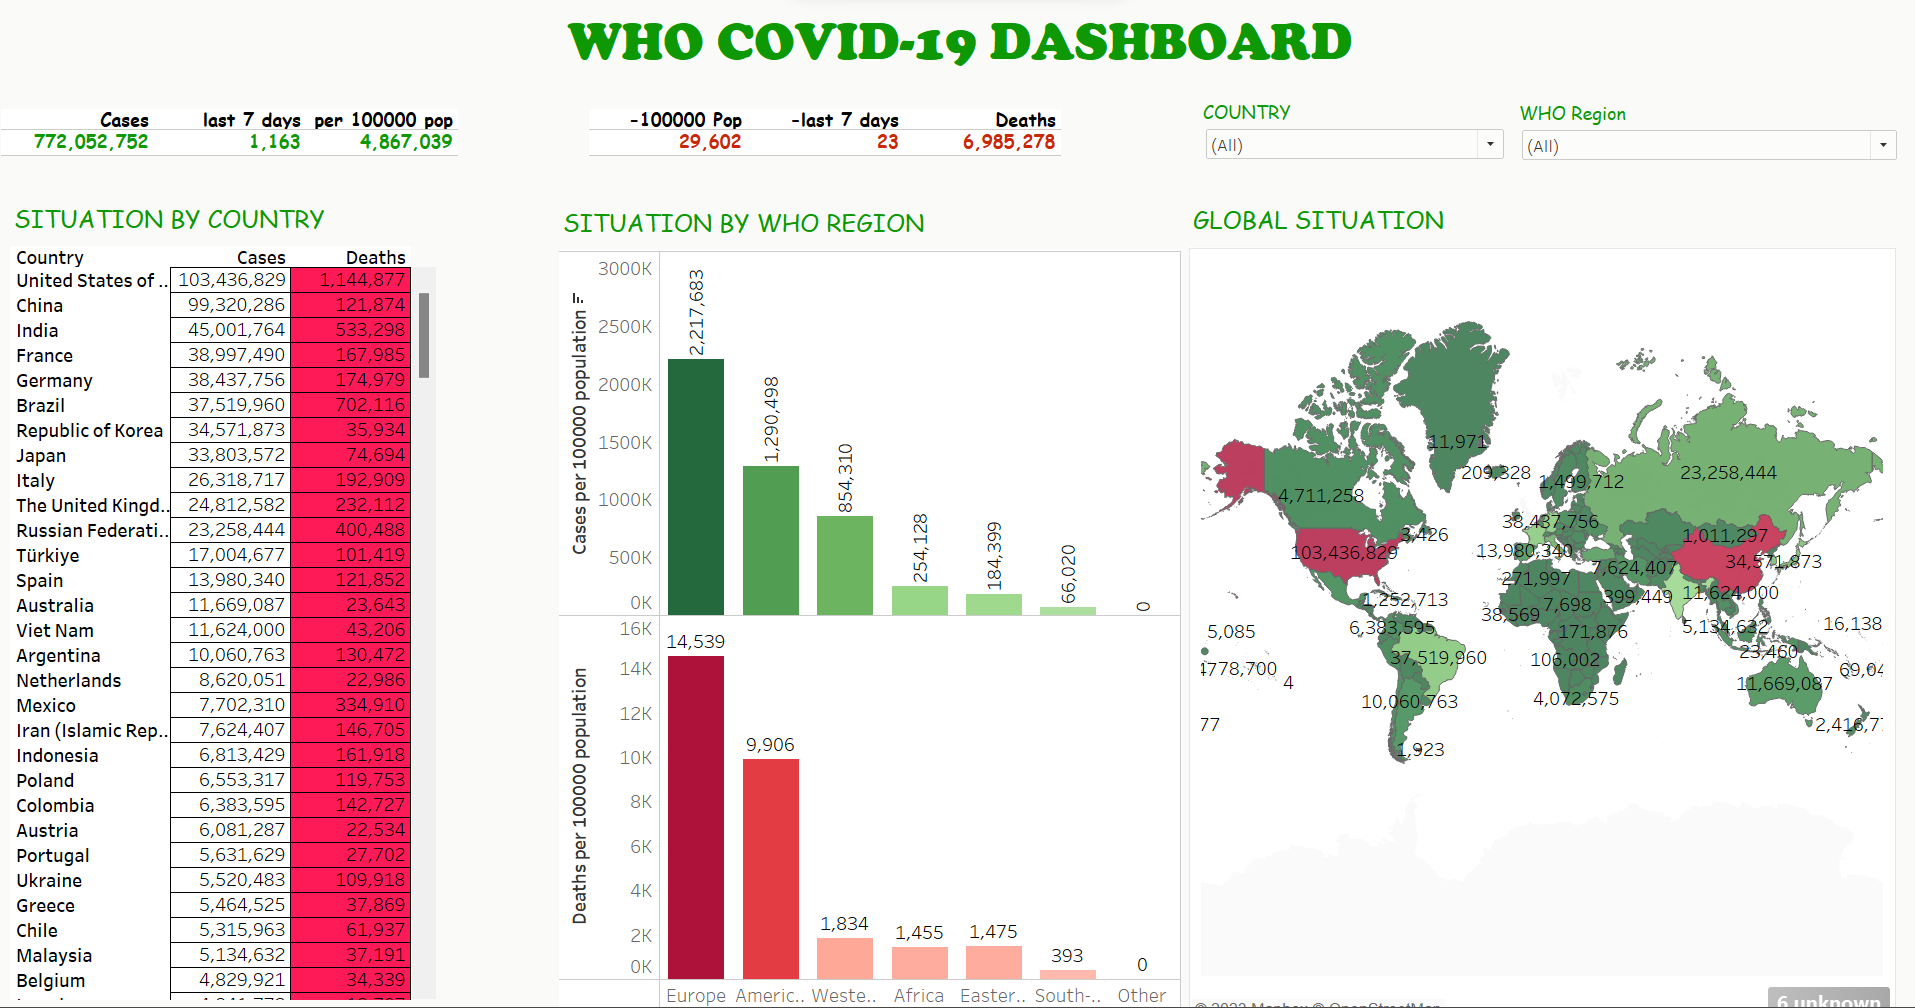
WHO Covid-19 Dashboard
COVID-19, also known as coronavirus disease 2019, is caused by the SARS-CoV-2 virus. It emerged in December 2019 and rapidly spread worldwide, resulting in a global pandemic. The virus primarily spreads through respiratory droplets.
This analysis was carried out to explore global COVID-19 trends based on data from the World Health Organization (WHO).
🔍 Data Source
WHO Official Website
🛠️ Tools Used
Tableau Desktop
🎯 Objective
To understand the occurrence, trend, and severity of the COVID-19 pandemic worldwide.
📊 Data Overview
The dataset consisted of 12 columns and 237 rows, including the following variables:
- Country
- WHO Region
- Cases - Cumulative Total
- Cases per 100,000 Population
- Cases - Reported in Last 7 Days
- Cases - Last 7 Days per 100,000 Population
- Cases in Last 1 Hour
- Deaths - Cumulative Total
- Deaths per 100,000 Population
- Deaths - Reported in Last 7 Days
- Deaths - Last 7 Days per 100,000 Population
- Deaths in Last 1 Hour
🧹 Data Cleaning & Analysis
No cleaning was required; the dataset was ready for analysis.

📈 Data Visualization
The data was analyzed and visualized using Tableau Desktop. Key performance indicators (KPIs) were computed using calculated fields. Example formulas:
- Total Cases:
SUM([Cases - Cumulative]) - Last 7 Days:
SUM([Cases - Last 7 Days]) - Per 100,000 Population:
SUM([Cases per 100k population])
🔍 Findings

🔹 United States (103,436,829) and China (99,320,286) recorded the highest number of confirmed cases.

🔹 United States and Brazil reported the highest death toll.

🔹 Europe and the Americas experienced the highest number of cases per 100,000 population.

🔹 African, Eastern Mediterranean, and South-East Asian countries reported the lowest number of cases and deaths.
Thank you for viewing this project.
WHO COVID-19 Analysis
- Category Tableau Project
- Project URL Tableau Public
- Visit Github
- More tableau projects