LimeCore Churn Analysis: A Data-Driven Report
1. Project Overview
In this project, I performed a comprehensive analysis of a bank's customer data to understand and address the critical business problem of customer churn. The goal was to identify the key factors influencing customer attrition, quantify the problem, and provide actionable, data-driven recommendations to improve customer retention and drive sustainable growth.
2. The Challenge
- Who are our churned customers?
- What are their age groups, credit scores, gender, geography, and card types?
- Is there a link between churn and satisfaction scores or complaints?
- Do customers with low product engagement tend to churn more?
- Does having a credit card or being an active member reduce churn?
- Are high earners or those with higher balances more loyal?
- What role does tenure play in churn likelihood?
- Which card types are more prone to churn?
- Are there any geographic regions with higher churn rates?
- Does churn correlate with the number of points earned or card usage?
- Can we identify a customer churn risk profile for early detection?
3. Executive Summary
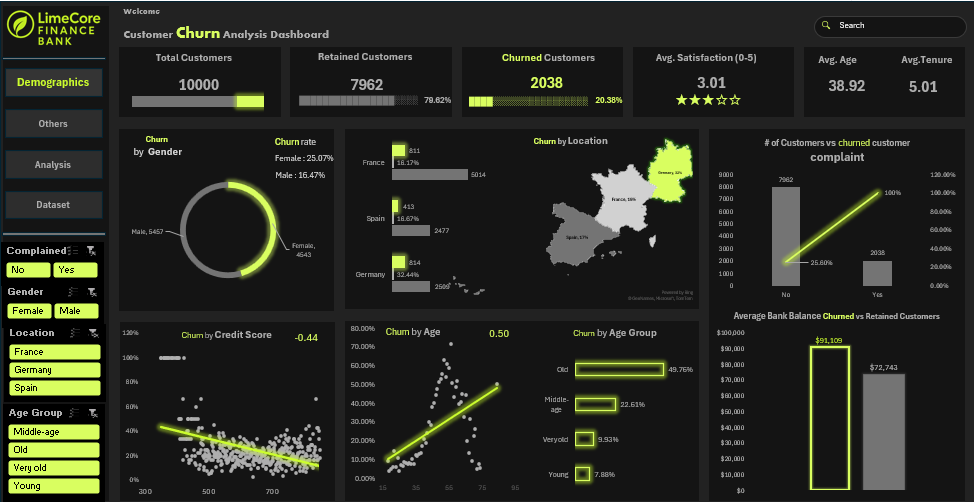
This report provides a comprehensive analysis of the customer churn dataset, identifying key performance indicators (KPIs) and the primary drivers of customer attrition. The analysis reveals a churn rate of 20.38%, which translates to 2,038 customers leaving the bank. A particularly critical finding is the 100% churn rate for customers who have lodged a complaint. The report also details how demographic, geographic, and behavioral factors contribute to this trend, offering data-driven insights for strategic intervention.
4. Key Performance Indicators (KPIs)
Based on the provided data, the overall health of the customer base is summarized by the following metrics:
- Total Customers: The dataset contains a total of 10,000 customers.
- Returned Customers: A total of 7,962 customers have been retained.
- Churned Customers: A total of 2,038 customers have exited the bank.
- Retention Rate: The overall retention rate is 79.62%.
- Churn Rate: The overall churn rate is 20.38%.
The average characteristics of the customer base are:
- Average Satisfaction Score: The average satisfaction score is 3.01 on a scale of 1 to 5.
- Average Age: The average age of customers is 38.92 years.
- Average Tenure: The average tenure of customers with the bank is 5.01 years.
5. Detailed Findings & Analysis
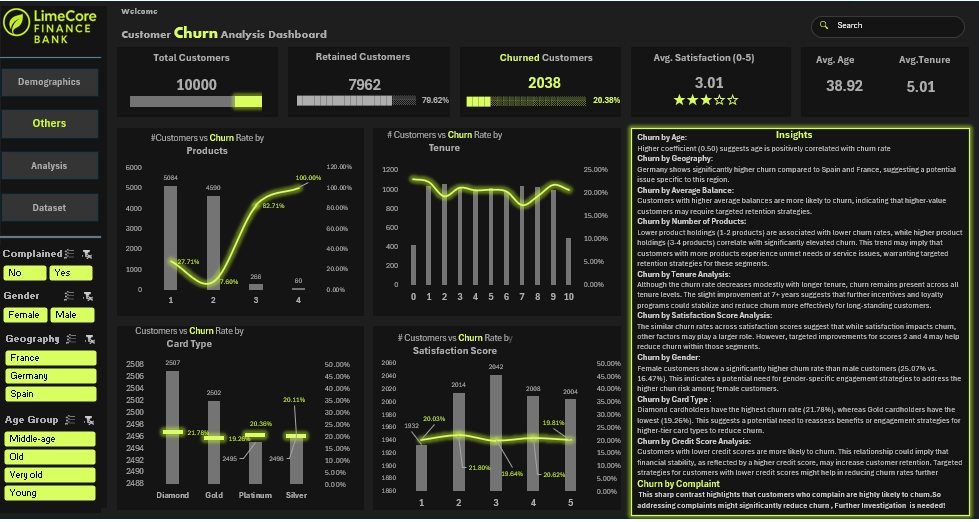
A higher coefficient of 0.50 suggests that age is positively correlated with the churn rate, indicating that as customers get older, their likelihood of churning increases.
Germany shows a significantly higher churn rate compared to Spain and France, suggesting a potential issue specific to this region.
Customers with higher average balances are more likely to churn, indicating that higher-value customers may require targeted retention strategies.
Lower product holdings (1-2 products) are associated with lower churn rates, while higher product holdings (3-4 products) correlate with significantly elevated churn. This trend may imply that customers with more products experience unmet needs or service issues, warranting targeted retention strategies for these segments.
Although the churn rate decreases modestly with longer tenure, churn remains present across all tenure levels. The slight improvement at 7+ years suggests that further incentives and loyalty programs could stabilize and reduce churn more effectively for long-standing customers.
The similar churn rates across satisfaction scores suggest that while satisfaction impacts churn, other factors may play a larger role. However, targeted improvements for scores 2 and 4 may help reduce churn within those segments.
Female customers show a significantly higher churn rate than male customers (25.07% vs. 16.47%). This indicates a potential need for gender-specific engagement strategies to address the higher churn risk among female customers.
Diamond cardholders have the highest churn rate (21.78%), whereas Gold cardholders have the lowest (19.26%). This suggests a potential need to reassess benefits or engagement strategies for higher-tier card types to reduce churn.
Customers with lower credit scores are more likely to churn. This relationship could imply that financial stability, as reflected by a higher credit score, may increase customer retention. Targeted strategies for customers with lower credit scores might help in reducing churn rates further.
This sharp contrast highlights that customers who complain are highly likely to churn. The data suggests that addressing complaints might significantly reduce churn rates. Further investigation into the specific nature of these complaints is warranted to develop a more robust resolution process.
6. Recommendations
- Urgent Complaint Resolution Overhaul: Given the 100% churn rate for customers who complained, the bank must immediately and comprehensively restructure its complaint handling process. The new process should focus on restoring customer satisfaction and trust, not just resolving the initial issue.
- Targeted Retention Campaigns: Develop specific retention campaigns for high-churn regions (e.g., Germany) and for customers in high-risk demographic and behavioral segments, particularly females and older customers.
- Proactive Credit Score Monitoring: Utilize the -0.44 correlation to proactively identify customers with declining credit scores. Engage these customers with personalized financial guidance or tailored product offers to prevent churn.
- Product Portfolio Review: Investigate why customers with multiple products are churning at a higher rate. This may involve simplifying product offerings, clarifying fee structures, or enhancing the value proposition for multi-product customers.
7. Conclusion
The analysis provides a clear picture of customer churn, demonstrating a significant churn rate and identifying a strong negative correlation between credit score and churn. By leveraging these insights, the bank can move from a reactive to a proactive churn management strategy. Implementing targeted interventions based on geography, demographics, and credit score, along with a focus on improving customer satisfaction and urgently revamping the complaint resolution process, will be key to enhancing customer retention and driving sustainable growth.
Project Information
- Category Data Visualization, Financial Analysis
- Client Self-Initiated Project
- Project Date 2025
- Project URL View Workbook
Tools & Technologies
- Excel
- Data Visualization
- Pivot Tables
- Business Intelligence (BI)