Customer Segmentation Analysis on Brazilian E-commerce Data
Beyond the Cart: A Human-Centered Approach to Brazilian E-commerce
You know how it goes. Sometimes you start a project just to, you know, get your feet wet. That's kinda what happened with this Brazilian e-commerce dataset from Olist. I first jumped into it during an internship and created this dashboard that was, well, pretty descriptive. It told me what was going on, what products were selling, where they were selling, but it was missing the why. It was just a snapshot, a nice-looking report card of the past.
And honestly, that wasn't enough for me. As I kept learning, I got an itch. I started asking those deeper questions that actually matter to a business: Who's our best customer? Which ones are about to bail on us? Can we, like, actually group these people in a way that makes a real difference?
So, this project, this whole RFM thing, is the answer to that itch. It’s my way of turning that dusty, descriptive data into a living, breathing strategy.
So, What Did I Find?
Going from a basic dashboard to this strategic segmentation felt like getting new glasses. Suddenly, the picture was crystal clear. Here are a few things that really blew my mind and changed the whole game:
- From "Just Sales" to "OMG, Opportunity!": The first dashboard just showed a ton of one-time buyers. I mean, a lot of them. At first glance, that might seem like a bummer, but my RFM analysis showed it's the exact opposite, it’s our biggest opportunity. It means we have a massive pool of new customers just waiting to be nurtured into repeat business. That's money just sitting there.
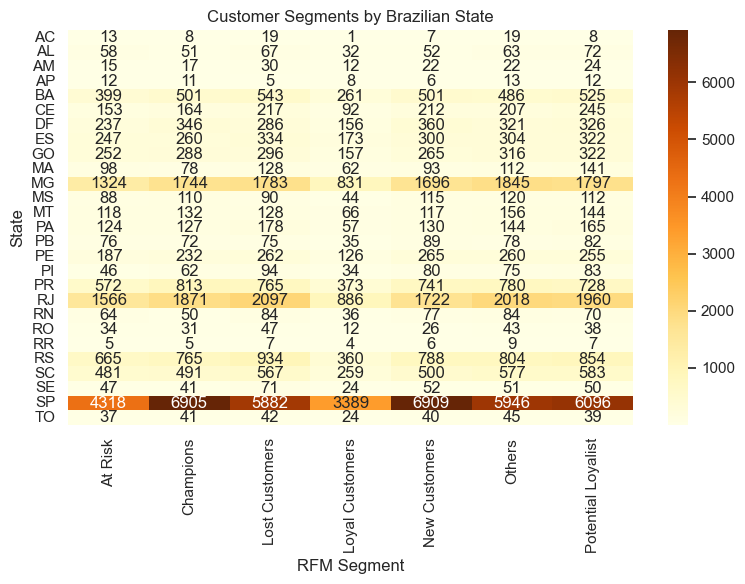
- From "Top Cities" to "Okay, It's War Time": My initial report showed that cities like São Paulo and Rio de Janeiro were our sales powerhouses. well that was expected. But the RFM model dug deeper and, surprise, surprise, it turns out those very same cities have our highest concentration of "Lost Customers." It's almost like a ticking time bomb. This isn't just a fun fact, it's a huge neon sign saying, "Hey, we need to launch some geo-targeted win-back campaigns here, like, yesterday."
- From Generic to Personal: Before, I knew which product categories were popular. Great! Now, thanks to this segmentation, I know that our "Champions" (the VIPs!) are the ones buying high-end stuff like home decor and health products. Meanwhile, our "New Customers" are just dipping their toes in with tech accessories. It's like the difference between a high-end department store and a thrift shop, they're two completely different mindsets. This lets us ditch the one-size-fits-all marketing and get personal.
- From Describing to Doing: This whole project isn't just about showing off, it's about action. The RFM analysis gave us a literal playbook. For instance, our "At Risk" segment might be a pain point, but they actually have the highest average value. So, guess what? They're a top priority for reactivation. We know our "Champions" need a killer loyalty program, and our "New Customers" need a welcoming hand to keep them coming back. It's a whole different level of strategic thinking.
The Recipe: How I Made It All Happen
This wasn't some magic trick, it was a methodical process, building on my past work. I wanted to make sure everything was solid.
-
Gathering the Ingredients: I pulled in five datasets, orders, customers, items, products, and even some category translations, and mashed them all together into one big, beautiful DataFrame.
-
Cleaning Up: I handled missing values, converted some tricky timestamps, and calculated the total revenue for each order. A little spring cleaning, if you will.
-
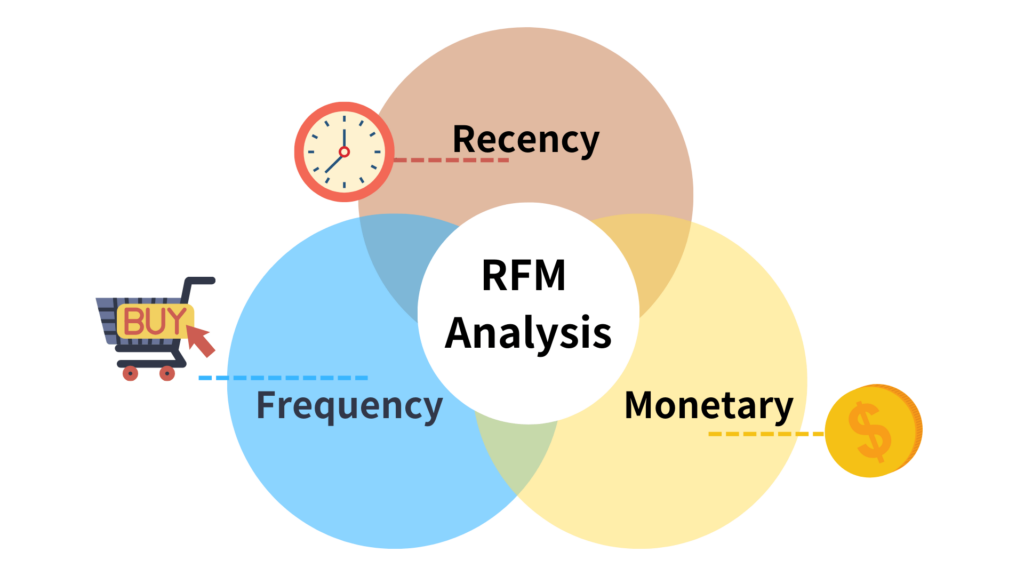
Crunching the RFM Numbers: I set a "snapshot date" (just one day after the last purchase to keep things clean) and then calculated the Recency, Frequency, and Monetary values for every single customer.
-
A Little Exploratory Fun: Before getting into the heavy lifting, I visualized the RFM metrics with some histograms. This was super helpful for spotting patterns and outliers, it’s like getting a feel for the data's personality.
-
The Segmentation: This was the fun part! I assigned RFM scores and grouped everyone into those now-familiar segments. "Champions," "At Risk," "Lost Customers," "Newbies," and "Potential Loyalists." The names say it all, right?
-
Getting to Know Them: I then profiled each segment to see how they behaved, what they bought, and where they were from. This is where the real stories emerged.
I did all of this in a Jupyter Notebook, using Python with Pandas for the data work and Matplotlib and Seaborn to make the visualizations look good. The notebook itself is an open book, so you can see exactly how I got from point A to point B.
A Visual Story of What I Found
The visualizations were my sidekick, helping me turn dry numbers into compelling visuals.
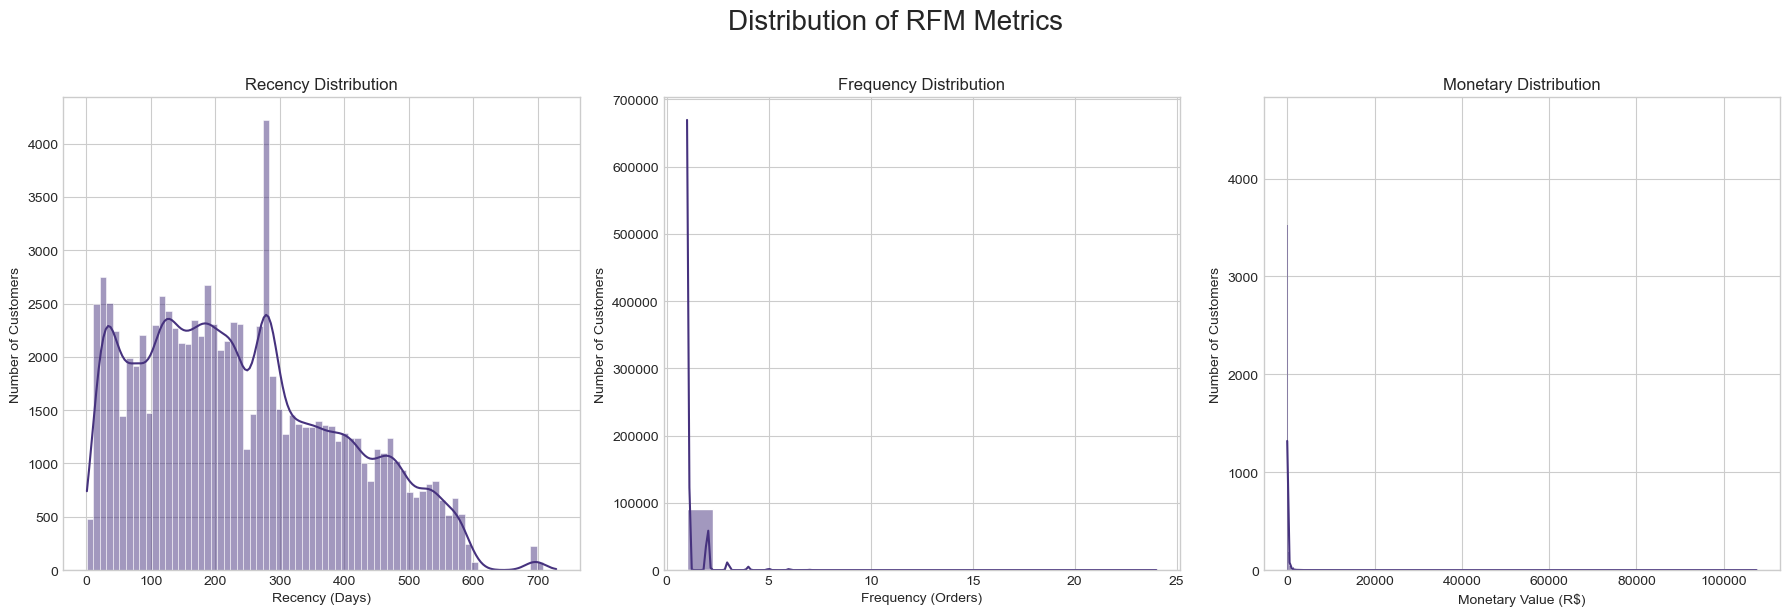
RFM Metric Distribution
I looked at histograms for each RFM metric. What I saw was eye-opening. The Recency chart was skewed way to the right, this means a ton of people haven't bought from us in a while, a massive churn risk. The Frequency chart? Pretty much everyone is a one-and-done shopper, which is a call to action if I've ever seen one. And the Monetary chart showed a long tail, with a small group of big spenders carrying the load.
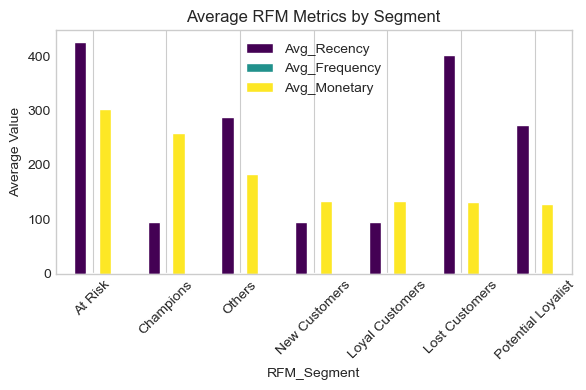
Segment Profiling
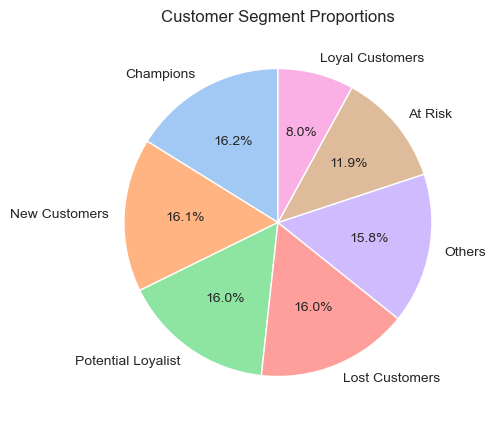
I then used charts to show the average RFM scores for each segment. "At Risk" customers, for example, had the highest monetary value, which is like finding a pile of cash you forgot you had. The pie chart showed that our biggest groups were "Champions" and "New Customers." That told me we have two main goals: keep the best happy, and convert the newbies.
Average RFM Metrics per Segment
Segment Distribution
Normalized Segment Profiles
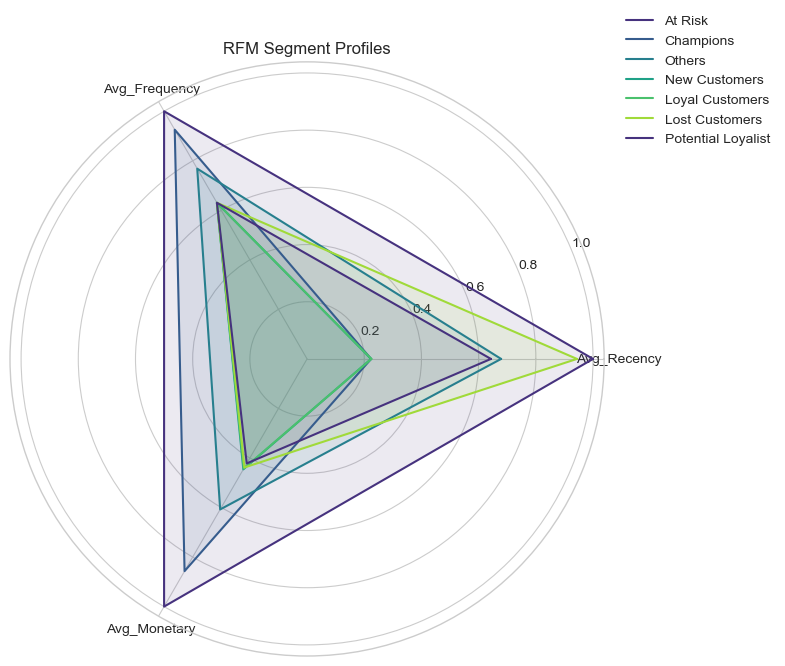
- Insight: The "Champions" really are our all-stars, scoring high on every metric, which makes them our most valuable and well-rounded group.
- The "Lost Customers" are pretty much the opposite, it’s no surprise they score lowest in every single dimension.
- Our "Potential Loyalists" are the ones to watch. They show promising behavior with moderate scores, so they're on the cusp of becoming a high-value segment if we can engage them the right way.
- The "Others" group is a bit of a wild card, they just don't fit neatly into any of the other categories.
- Recommendation: The lesson here is clear, we need to get personal with our offers and messaging, tailoring them to each segment's unique traits.
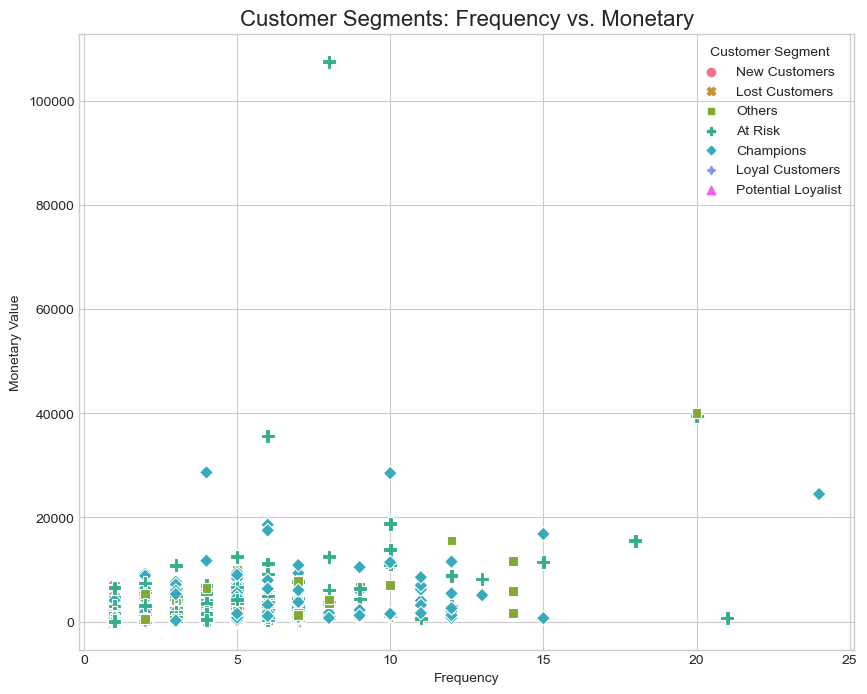
Behavioral Clustering
I plotted Frequency vs. Monetary value, and the segments just fell into place. "Champions" and "Loyal Customers" were up in the top right corner, our star players. The "Newbies" were hanging out in the middle, and the "Lost" and "At Risk" segments were in the bottom left, showing their low engagement. This visual clustering was a fantastic way to see the different groups in action.
Frequency vs. Monetary by Segment
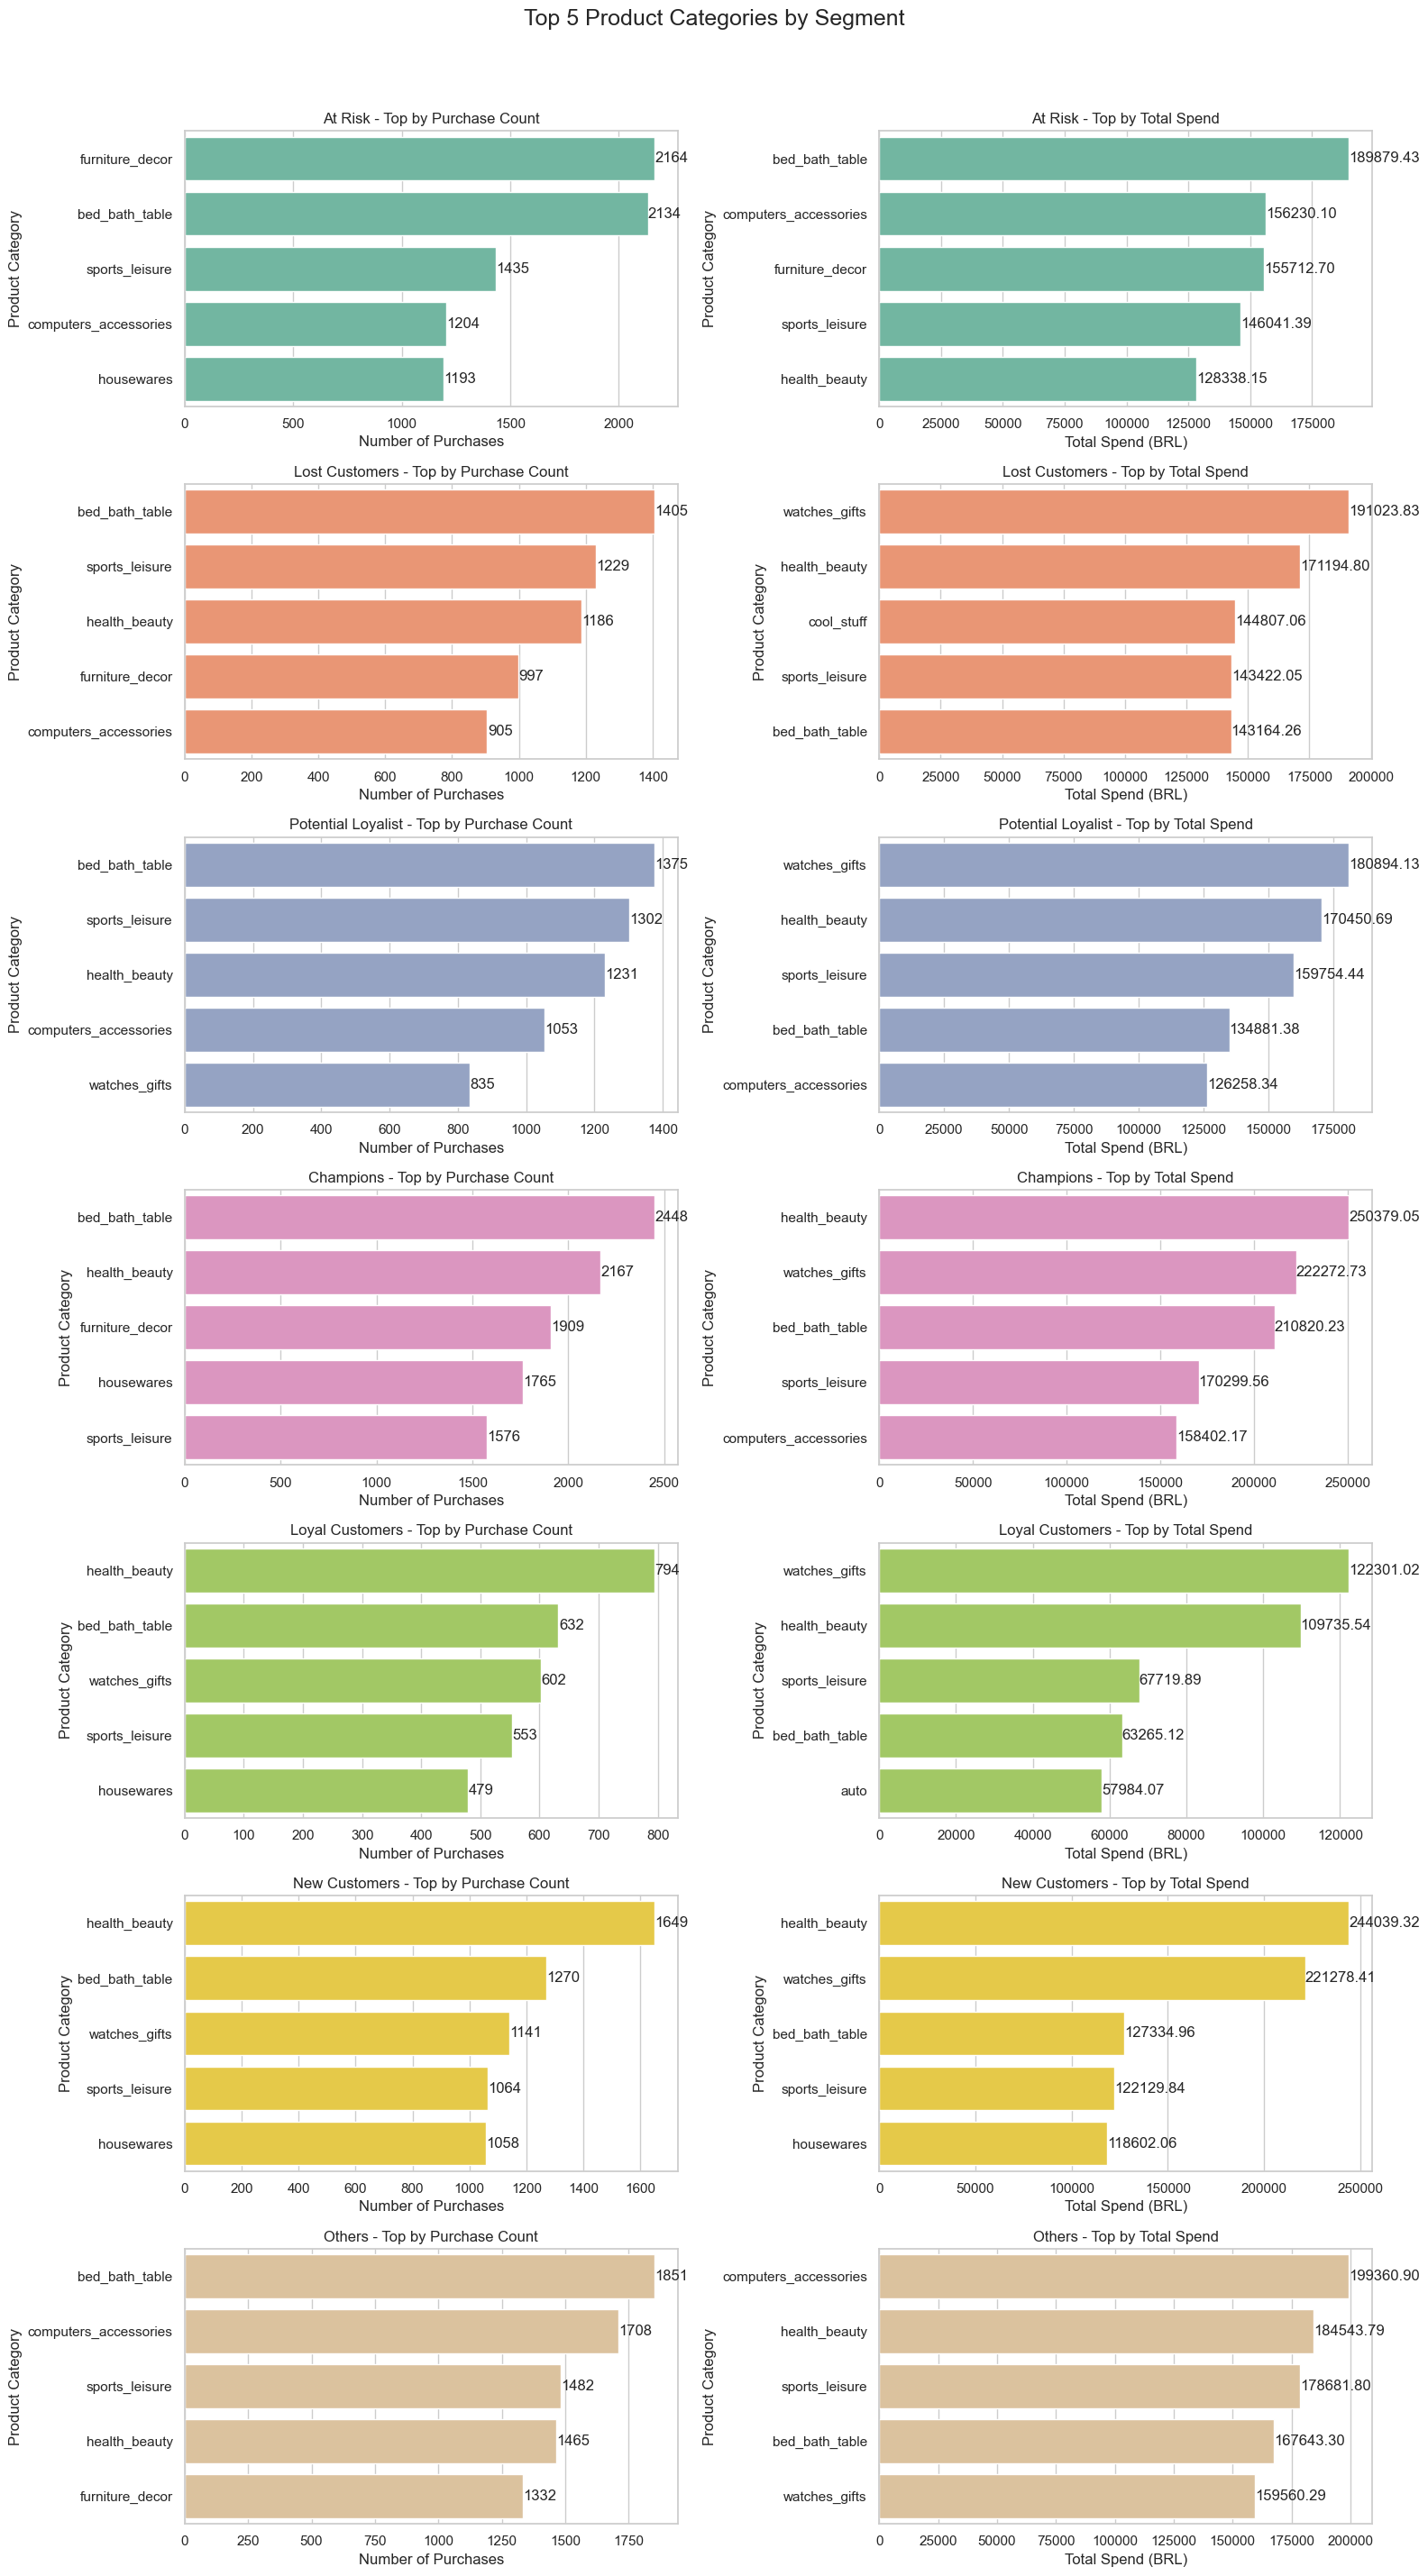
Product & Geographic Breakdown
I also broke down product categories and geographic distribution by segment. It turned out our "Champions" loved home and beauty products, while "New Customers" were more into tech and sports. And the biggest shocker? The "Lost Customers" were clustered in the same big cities that were once our biggest markets. It's a gold mine for localized marketing.
Top Product Categories by Segment
Segment Distribution Across Brazilian States
My Playbook: Actions Based on Data
This whole project isn’t just about making pretty charts. It was about creating a real, honest-to-goodness plan.
-
Nurture the Newbies: The majority of our customers are one-time buyers. We need to focus on them. I’d suggest a welcome email series with personalized recommendations and maybe a small discount. Let's make them feel at home.
-
Win Back the Lost: Our "At Risk" and "Lost" customers are a huge opportunity. I’d propose a high-impact win-back campaign with some killer deals. Since our "Lost Customers" are in specific cities, we should try targeted social media ads just for them. It’s a shot worth taking.
-
Reward Our Champions: These guys are the best of the best. We should treat them like it. A tiered loyalty program with special perks, early access to sales, free shipping, exclusive bundles, is a no-brainer.
-
Think Local, Act Personal: The data screams that a one-size-fits-all approach is a bust. We need to use those geographic and product insights to create marketing that feels like it was made just for them, whether they're in São Paulo or somewhere in the countryside.
A Little Concluding Thought...
Honestly, this project has been a huge journey for me. It’s shown me how to move past just reporting numbers and into real strategic thinking. It’s about building on what you already know, digging deeper, and finding that next layer of insight. For me, it's about how I approach problems, always refining, always learning, always looking for a better way to tell the story. This analysis isn't just a report, it's a blueprint for a more profitable business, and I'm genuinely proud of it.
Project Information
- Category Data Analysis, Customer Segmentation, RFM Modeling
- Project Date August 2025
- Client Self-Initiated Project
- Project URL View Live Notebook
- Related Project View Sales Dashboard
- View Analysis
Tools & Technologies
- Python
- Pandas
- Matplotlib
- Seaborn
- Jupyter Notebook